
WOO X Trader Profile | 2024
Designing performance insights for crypto traders
A mobile-native dashboard that turns complex trading data into clear infographics for crypto traders
crypto
Data Visualization
My Role
UX Designer
Team
UI Designer, Product Manager, Developers
Tools
Figma, FigJam, Slack, Jira
Timeframe
2023 - 2024 (Shipped)
Discovery
Understanding the mobile trading gap
Most WOO X users trade on mobile, accounting for nearly 70% of total trading volume, yet portfolio and performance tracking were only available on web. This disconnect made it difficult for traders to monitor performance where they traded most.
As we prepared to launch Social Trading, user feedback highlighted the impact of this gap. Traders complained that without mobile access to their portfolio, they couldn’t react quickly to market changes, often resulting in missed opportunities or losses.
Challenges
More than a responsive design
At first, the task seemed like adapting an existing desktop experience for mobile. But interviews with advanced traders revealed a deeper issue: performance data existed, but it wasn’t easy to interpret quickly.
The real challenge became designing a mobile experience that didn’t just show data, but helped traders understand risk and performance at a glance, especially in a leveraged trading environment where decisions need to be fast and confident.
How might we help traders understand portfolio performance and exposure at a glance on mobile?
process - exploration
Iterating on portfolio visibility
The portfolio view was the most complex feature to design. Advanced traders closely monitor long and short exposure to manage risk, especially when trading with leverage. They needed a quick way to understand both position balance and overall asset distribution.
I explored 4 design concepts and tested them with advanced traders. The insights were clear: traders relied heavily on the long–short bar chart and primarily referenced relative percentages over absolute ones. This led to the final direction: a variation of Proposal D, with the long–short bar chart always visible and relative percentages shown by default.
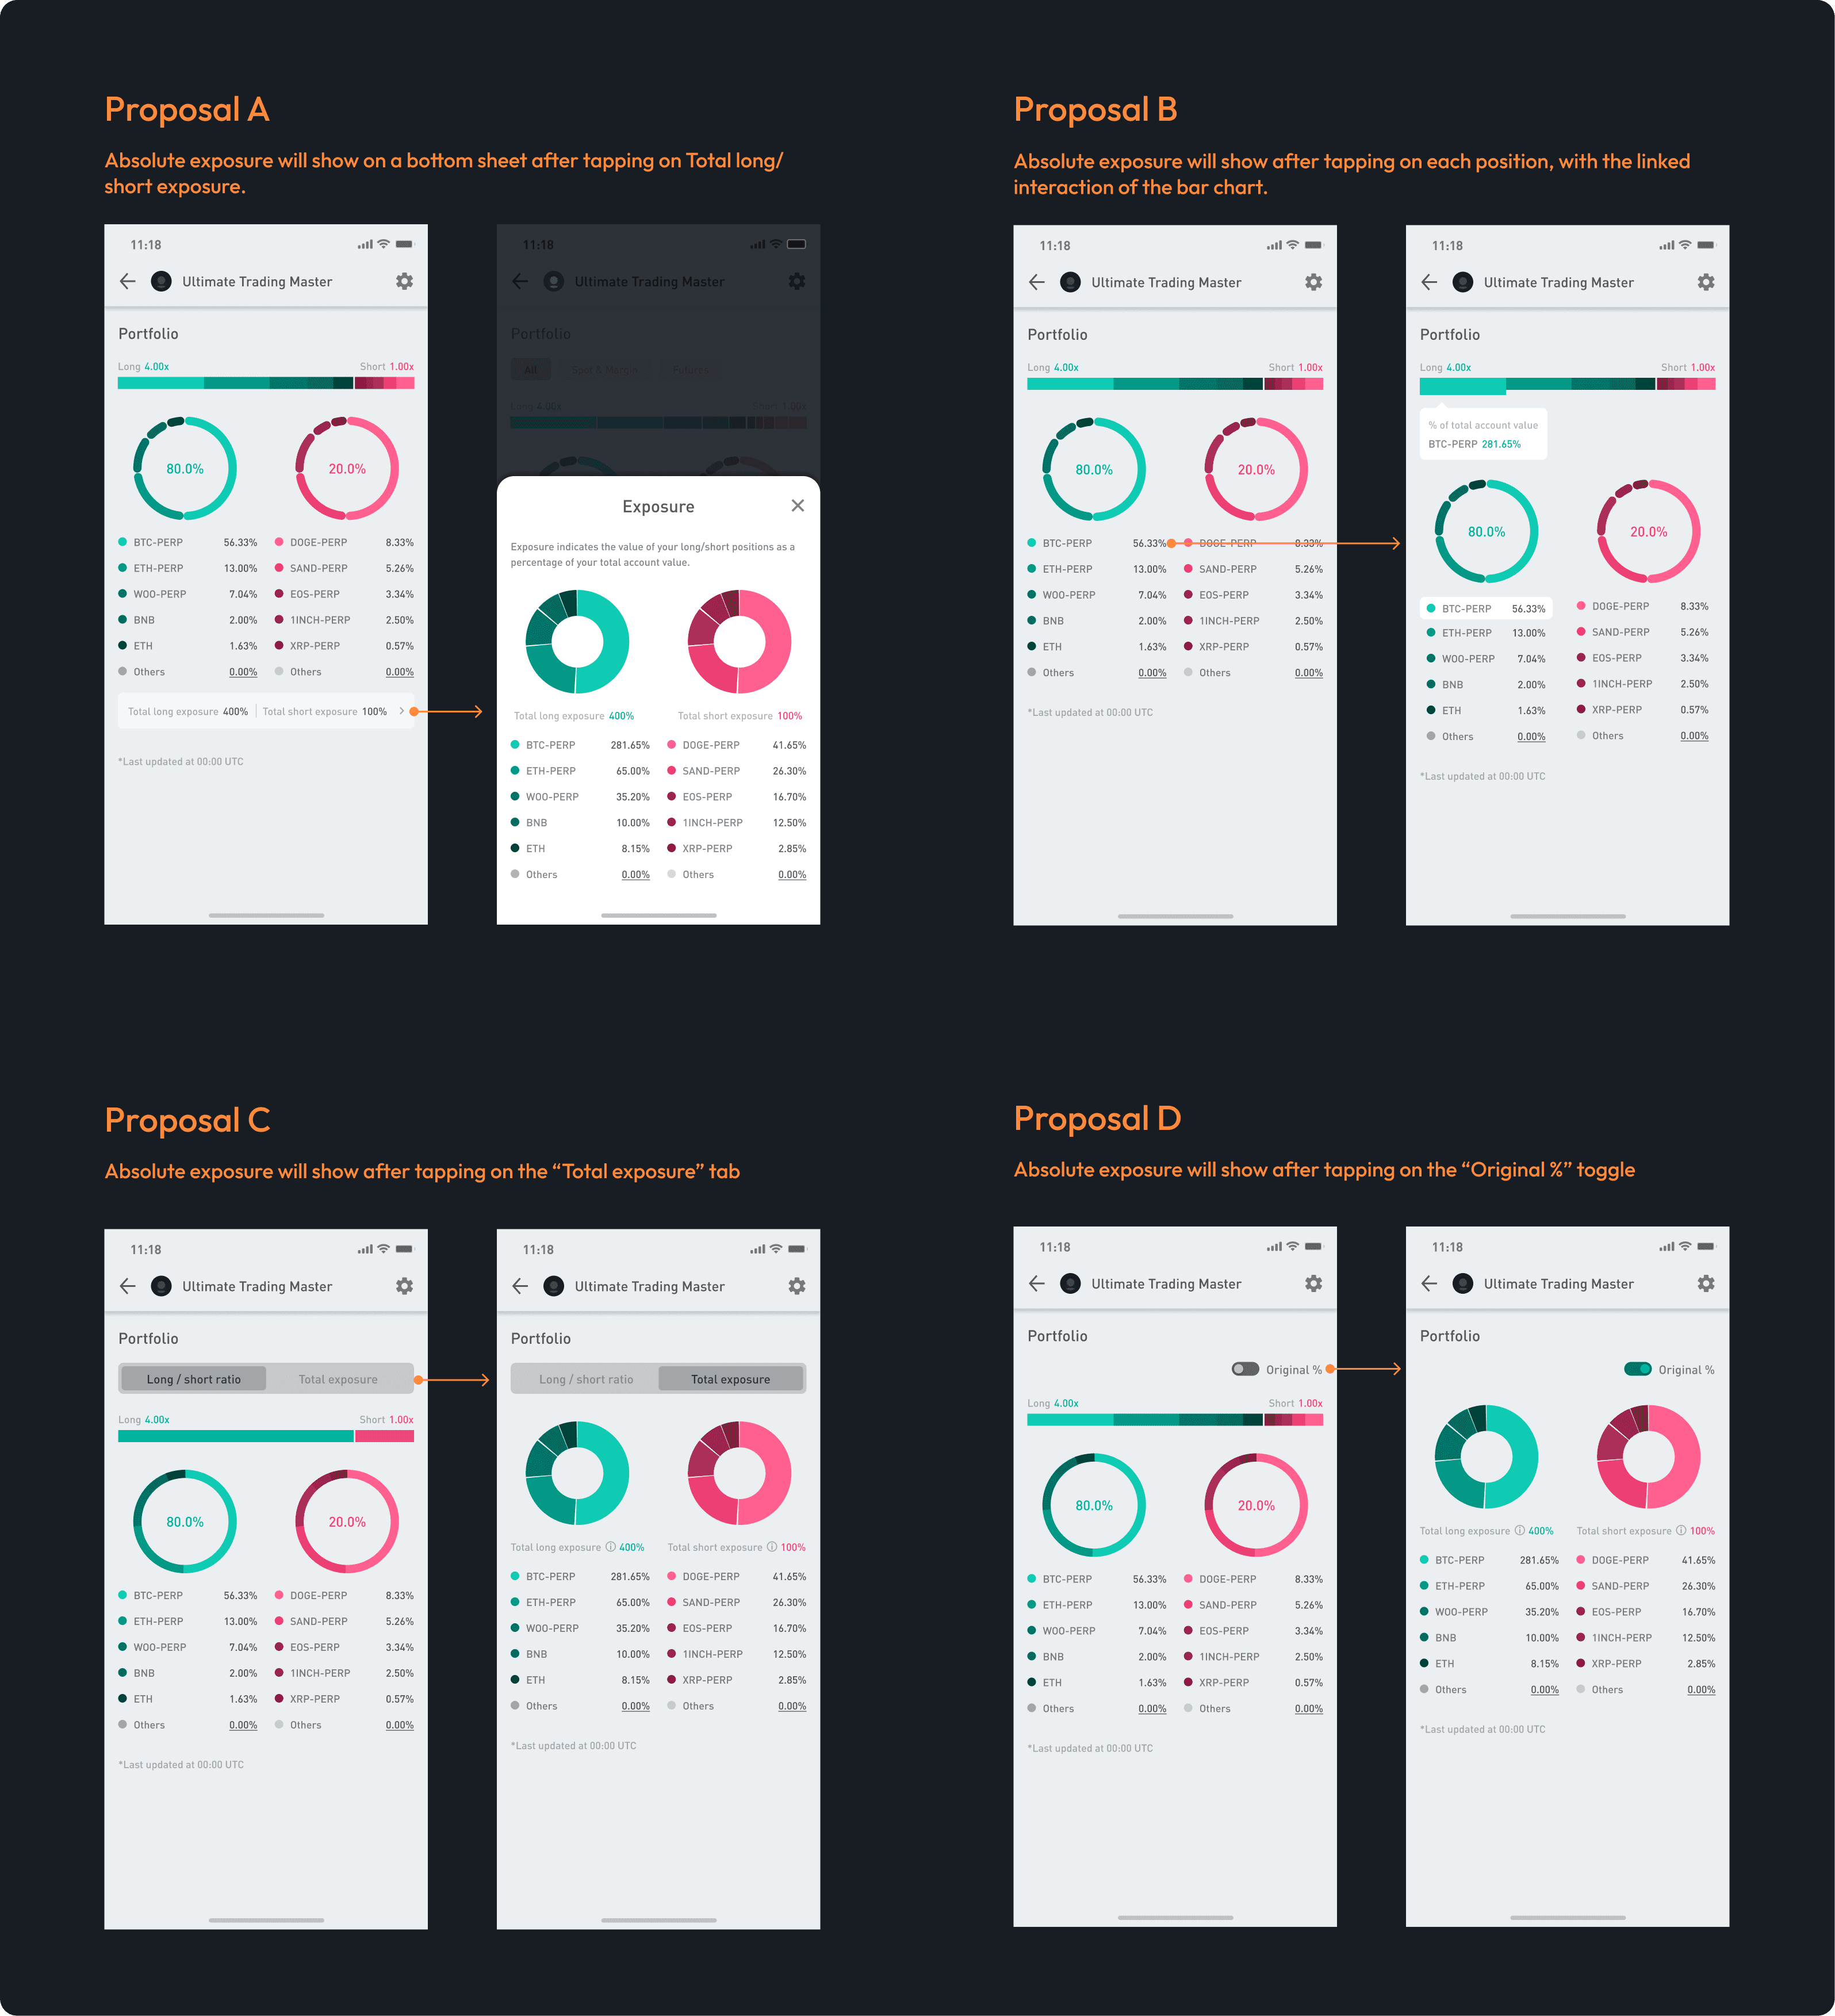
Design proposals for Trader Profile
process - Execution
Shipping with cross-functional partners
After aligning on the design direction, I led the interaction and visual design for the mobile Trader Profile. I partnered closely with a UI designer to refine color usage and chart styles, ensuring complex trading data stayed clear and readable on mobile.
I also worked closely with developers to translate designs into production, creating detailed design specs in Figma that covered interactions, edge cases, and data states. This helped reduce ambiguity during implementation and kept the shipped experience aligned with user needs.
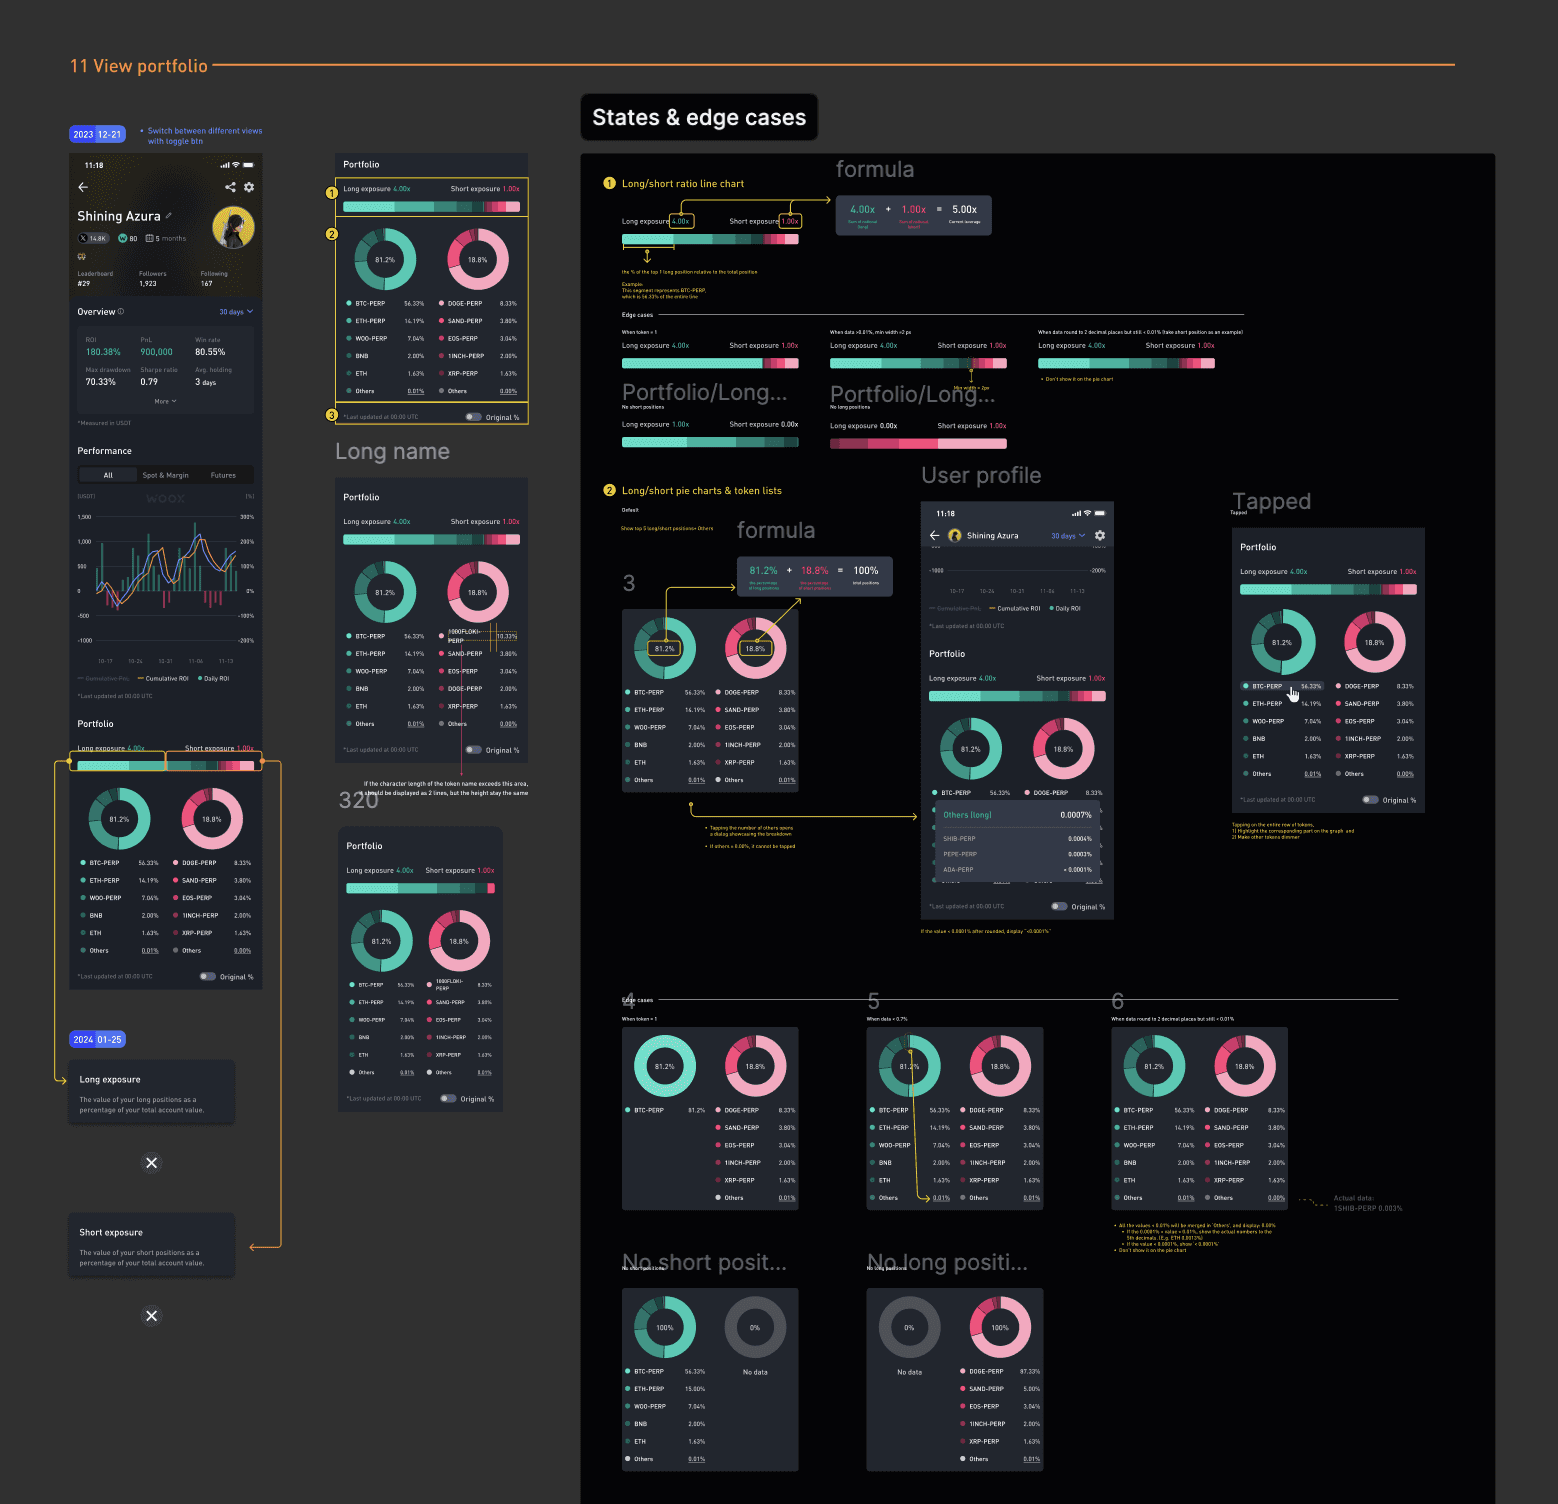
A screenshot of design specs
solution
A streamlined mobile experience for Trader Profile
The final design delivers a mobile-first Trader Profile that surfaces the most critical performance signals at a glance. The portfolio view prioritizes relative long and short exposure through a clear bar chart, allowing traders to quickly assess balance and risk without navigating multiple screens.
Key performance metrics such as ROI and profit and loss are grouped and visually structured to support fast scanning. Less frequently used details like absolute exposure remain accessible but secondary, reducing cognitive load while still supporting deeper analysis when needed.
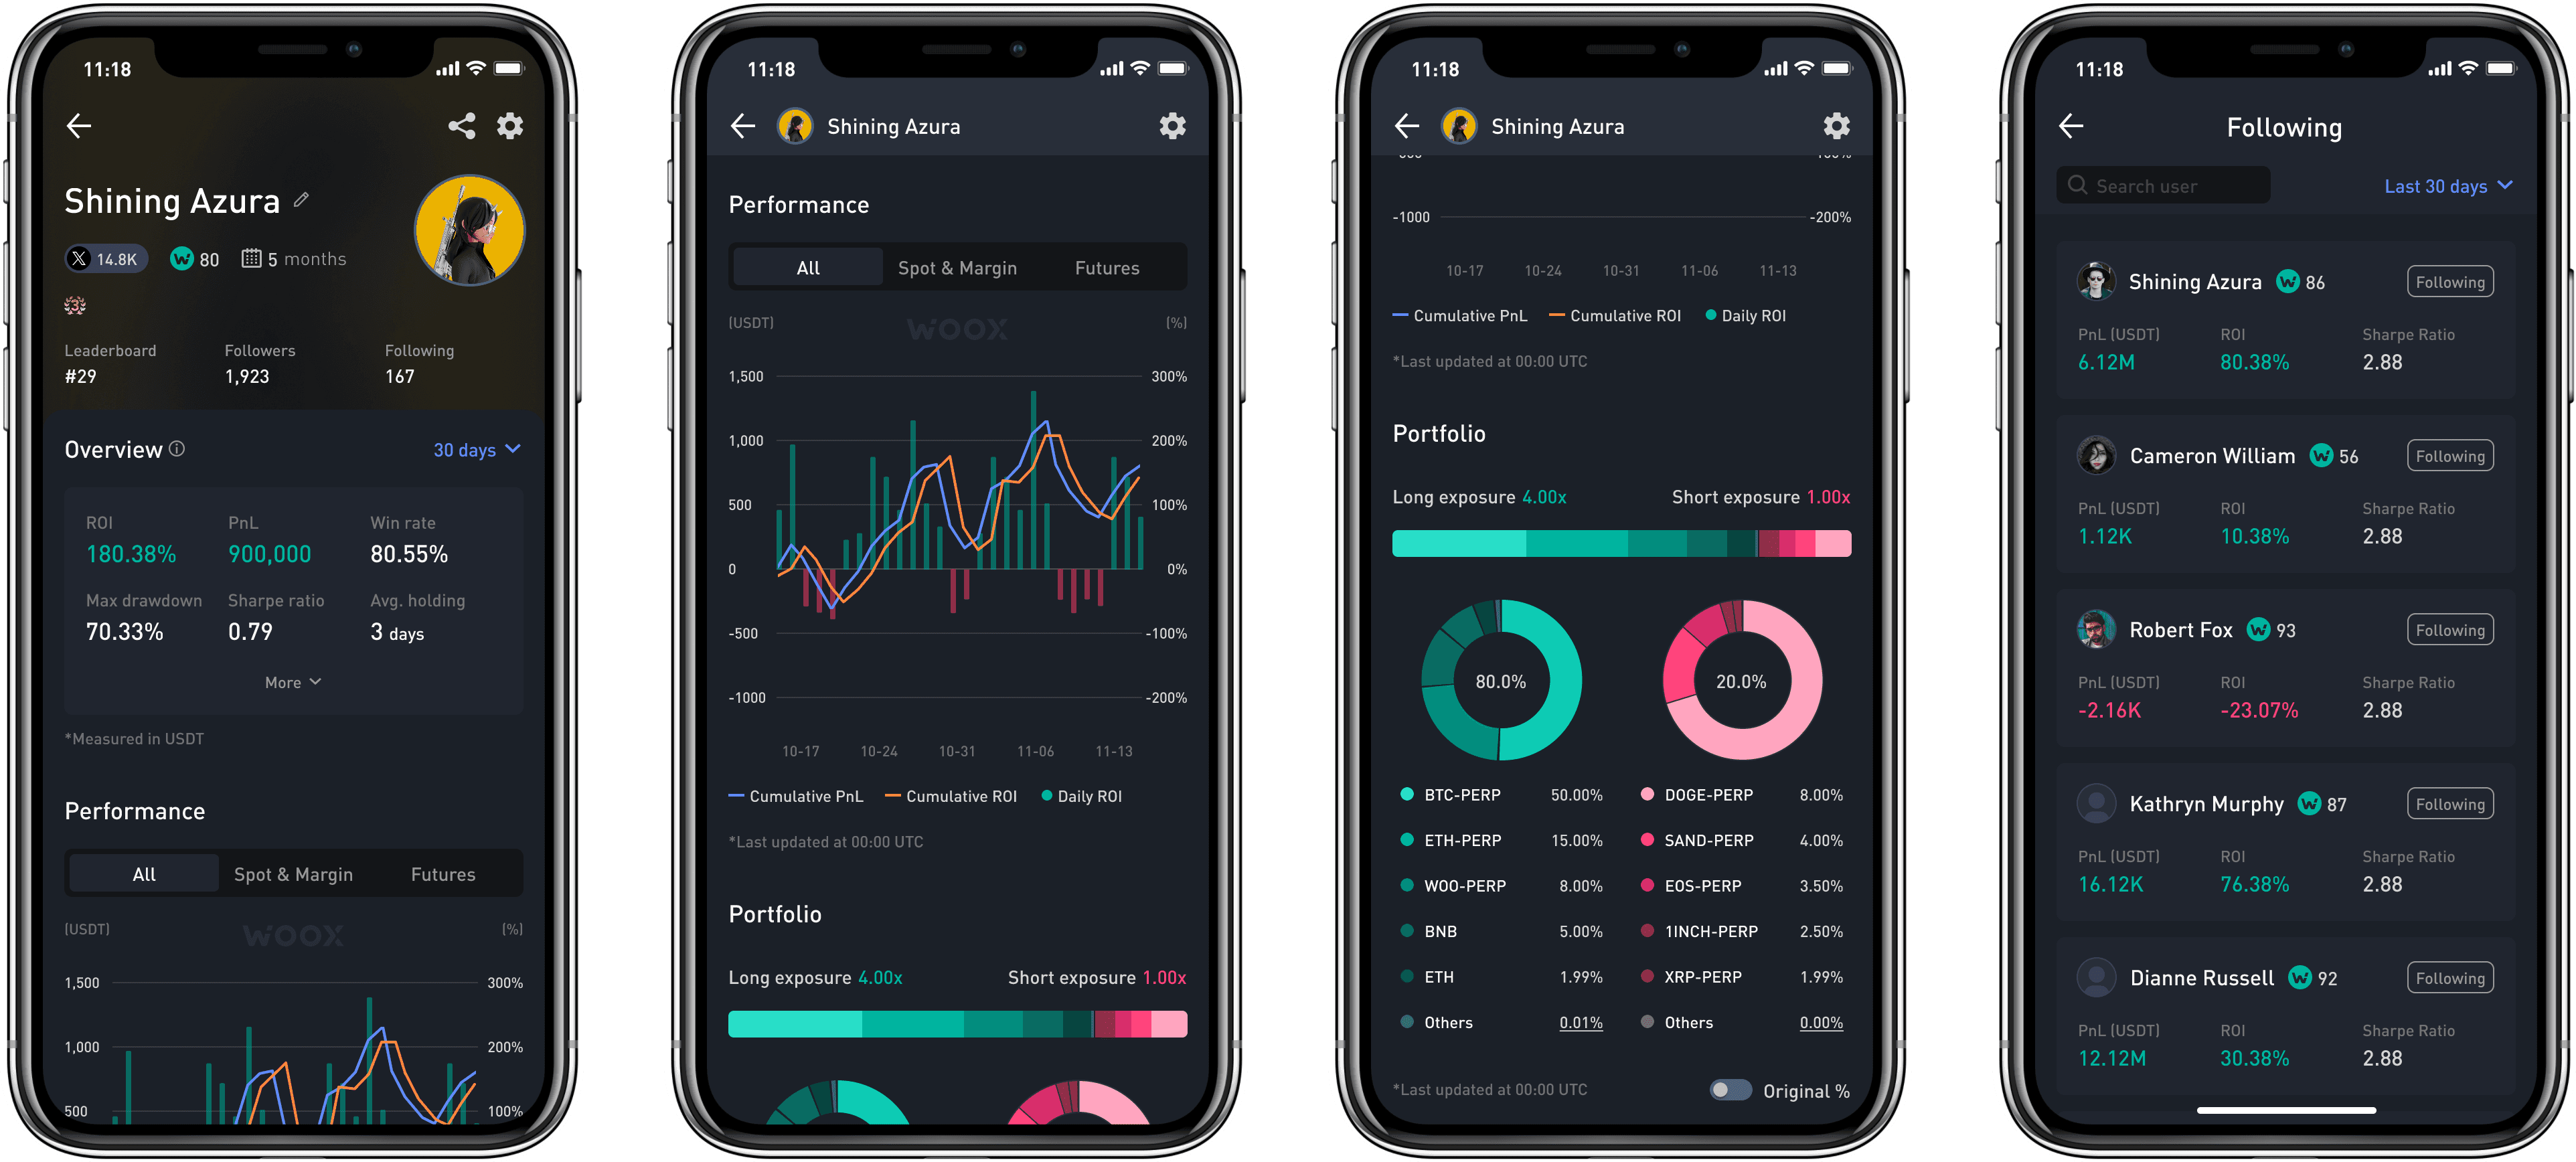
Outcome & Impact
Set the foundation for Social Trading, a top 2024 priority
The project brought performance tracking and portfolio health to mobile for 150,000+ traders, and established the mobile foundation for Social Trading, a top company priority in 2024.
"I really like that I can see my ROI and profit and loss line charts and my portfolio breakdown on mobile. I don’t need to wait until I’m home and sitting at my desk to adjust my orders."
— A trader with 3+ years on the platform
Reflection
From layouts to decision-making
This project challenged my initial assumption that mobile design was mainly about adapting layouts. Instead, it reinforced that clarity is what enables confident decision-making, especially in high-risk financial contexts.
As the sole UX designer, I learned to navigate ambiguity, align diverse stakeholders, and validate design decisions through direct trader feedback. The experience strengthened my ability to design for complex systems while keeping user needs front and center.